Introduction
MATLAB vs. Python
| MATLAB | Python |
|---|---|
| Commercial | Open Source |
| New functions via MATLAB Toolkits (no package manager) |
Installation of new modules with package manager (conda or pip) |
| Mainly procedual programming (Objects exists but are a hassle) |
Object oriented |
| Mathematical Programming Language | Gernaeral Purpose Language with many mathematical modules |
| No Namespaces for Core-Functions | Proper Namespaces (e.g. plt.plot instead of plot) |
| GUI included | Various GUIs available. We recommend Pycharm |
| Download: Mathworks | Download: Anaconda |
Numpy for MATLAB users
https://docs.scipy.org/doc/numpy-1.15.0/user/numpy-for-matlab-users.html
Common Libraries
- Numpy (Vector and Matrix operations, Numeric computing)
- Matplotlib (Plotting)
- Pandas (Table operations)
- Scikit-Learn (Machine Learning)
- Tensorflow / PyTorch (Neural Networks)
- SymPy (Symbolic computations)
- Seaborn (Advanced Plotting)
- …
Quickstart
import numpy as np
import matplotlib.pyplot as plt
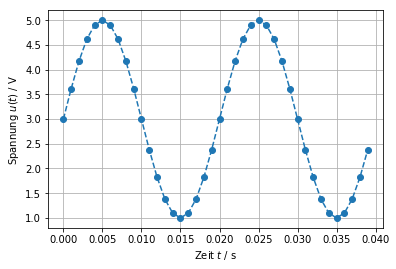
U_0 = 3 # V
u_peak = 2 # V
f_0 = 50 # 1/s
# Timevector in s (Sequence of numbers)
t = np.arange(start=0, stop=0.04, step=0.001)
u = U_0 + u_peak * np.sin(2 * np.pi * f_0 * t)
plt.plot(t, u, 'o--')
plt.xlabel('Zeit $t$ / s')
plt.ylabel('Spannung $u(t)$ / V')
plt.grid(True)